New features in Spyder 4's new debugger!

IPython is a great improvement over the standard Python interpreter, bringing many enhancements such as autocompletion and "magic" commands. When debugging, however, many of these features become inaccessible. With Spyder, we aim to bring back these capabilities and more for a truly premium debugging experience! (And believe me, I use this debugger a lot, and not only because I write code that might contain bugs :p).
In this post, I will describe the debugger improvements we've already made in Spyder 4, as well as those that are already implemented or under review for Spyder 4.2 and beyond.
Make the debugger more like IPython
IPython improves on the stock Python interpreter by adding syntax highlighting, completion, and history. We have done the same for the debugger!
The output is prettier (and easier to read) than plain black text, as it was in Spyder 3!
Code completion and history for the debugger use the same functionality as the IPython console, so you should not notice any difference in behaviour.
Just press Tab to trigger autocomplete suggestions, and use the up and down arrows to recall previous commands.
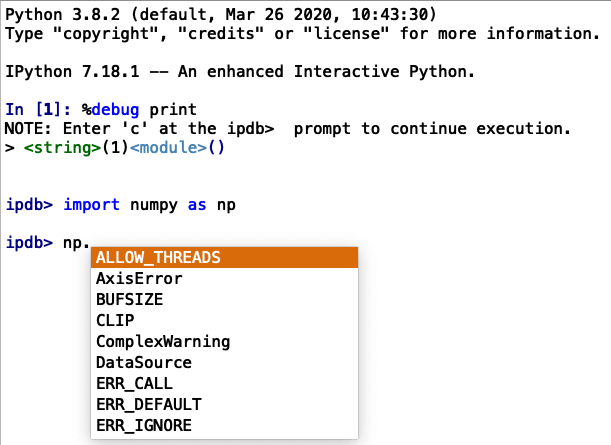
This can result useful if you don't know every library's documentation by heart!
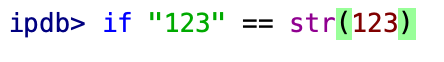
Another improvement that we added is the ability to write multiline statements.
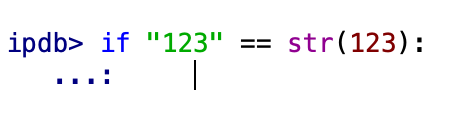
This is better than getting SyntaxError: unexpected EOF while parsing, as was the case in Spyder 3.
Finally, IPython has a lot of nice magic functions you can take advantage of.
I personally often use %matplotlib to switch between the qt5 and inline plotting backends, and %timeit to check how fast a given snippet of code is.
Now, these can be used in the debugger as well!

Core improvements
When debugging code, a lot of time can be lost stepping through other Python packages.
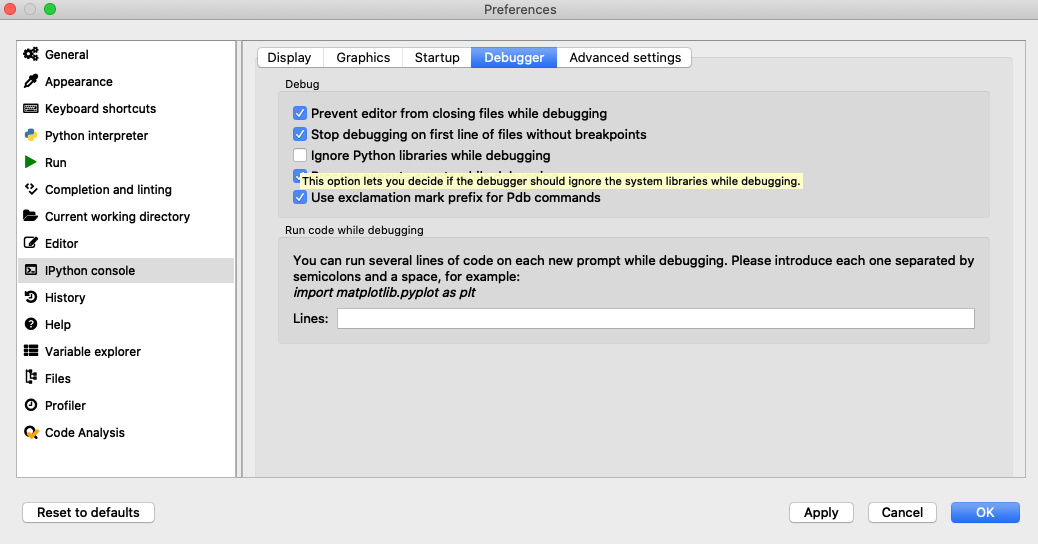
To avoid that, enable the new Ignore Python libraries while debugging option in Spyder's preferences under IPython Console > Debugger > Debug.
This will skip all the built-in and third-party Python modules and help you focus on your own code.
Another pain point for me is the mix of Pdb commands and Python statements when using the interactive prompt.
While debugging a script with a variable named step, for example, typing step in the Pdb prompt will not display the value of step, but will instead step through the code.
To avoid this, the Spyder 4.2 debugger will give precedence to Python expressions over Pdb commands; prefixing an expression with an exclamation mark will explicitly run it as a Pdb command.
This matches how the IPython Console handles clashes between magic functions and Python expressions, and contrasts with the previous behavior, where Pdb commands took precedence.
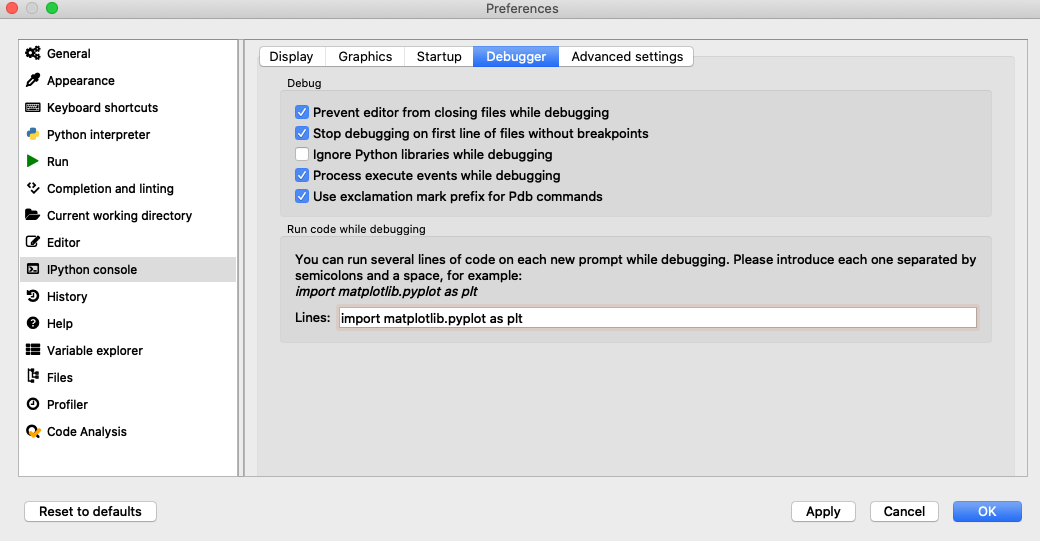
You can toggle this under IPython Console > Debugger > Debug in Spyder's preferences.
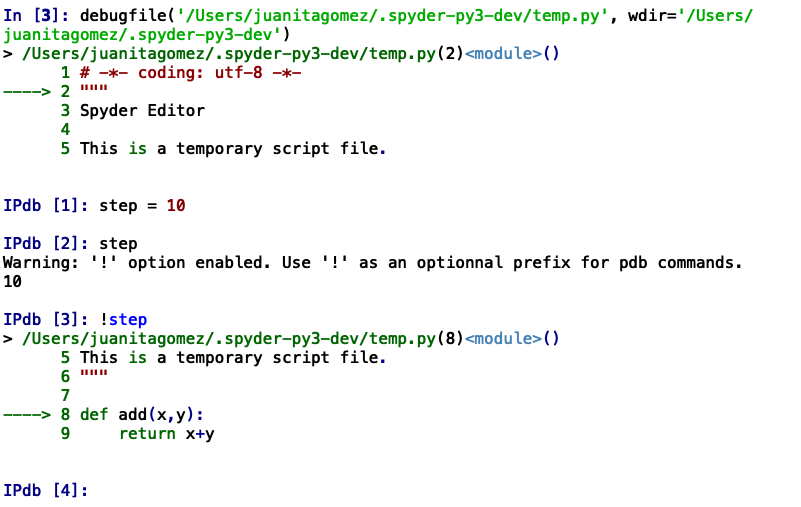
Here, you can see I can have a variable named step, and use it just as I would in the IPython console!
While debugging, the context changes constantly, which can be annoying if you need to use a certain module in each frame.
To address this, Spyder 4.2 will allow you to execute a snippet of code before any Pdb command.
I personally use import matplotlib.pyplot as plt so I can use Matplotlib anywhere with no extra commands!
You'll be able to set this up for yourself under Preferences > IPython Console > Debugger > Run code while debugging.
Matplotlib support
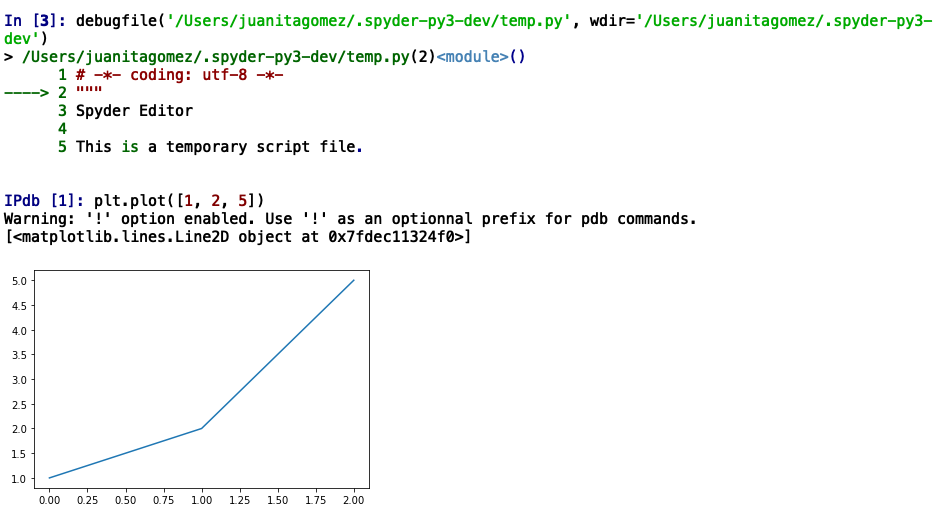
Speaking of using Matplotlib, two improvements will make your plotting life much easier while in the debugger.
First, if you use the inline backend, the Process execute events while debugging option in Preferences > IPython console > Debugger (on by defaults) enables plotting after each command.
If you would rather use an interactive backend, Spyder 4.2 will allow you to do that too! The event loop will be running while waiting for a Pdb input, which will bring Matplotlib figures to life!
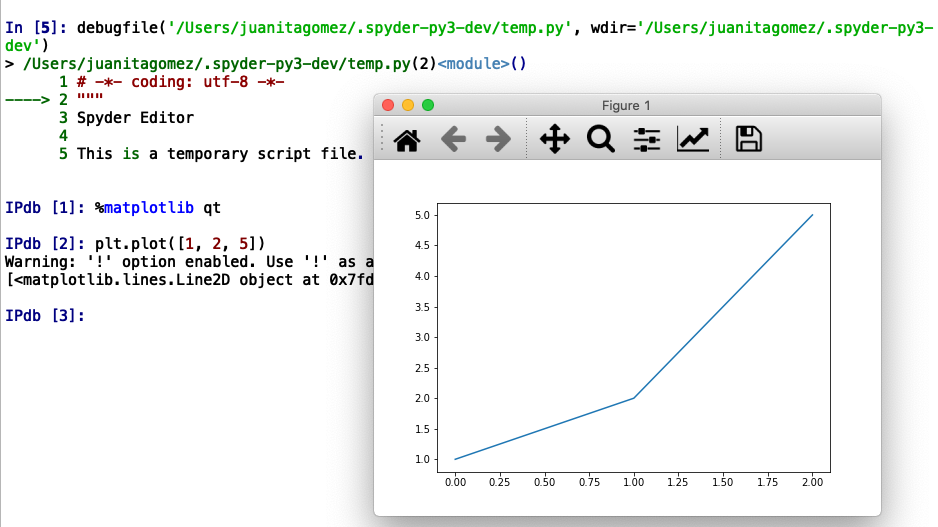
For example, interactive figures are great to zoom and pan.
Spyder Editor integration
By clicking next to the line number in the Editor, you can set a breakpoint to stop the debugger upon reaching that line.
With a Shift-click, you can set a conditional breakpoint that will only pause execution if an expression you write evaluates to True.
This is very useful if you are debugging a loop and want to go to a specific iteration, for example!
While debugging, the Editor will show you the line on which execution is stopped.
If you move around in the Editor, you can always go back to the current line by using the Pdb (w)here command.
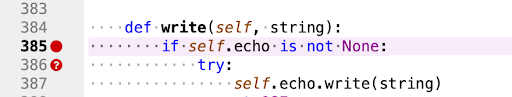
Here, you can see the Spyder debugger is stopped at the breakpoint on line 385, which is highlighted. The next line has a conditional breakpoint.
Other Spyder panes
Several other Spyder panes are useful while debugging. Breakpoints gives you a list of all the breakpoints you have set throughout your code.
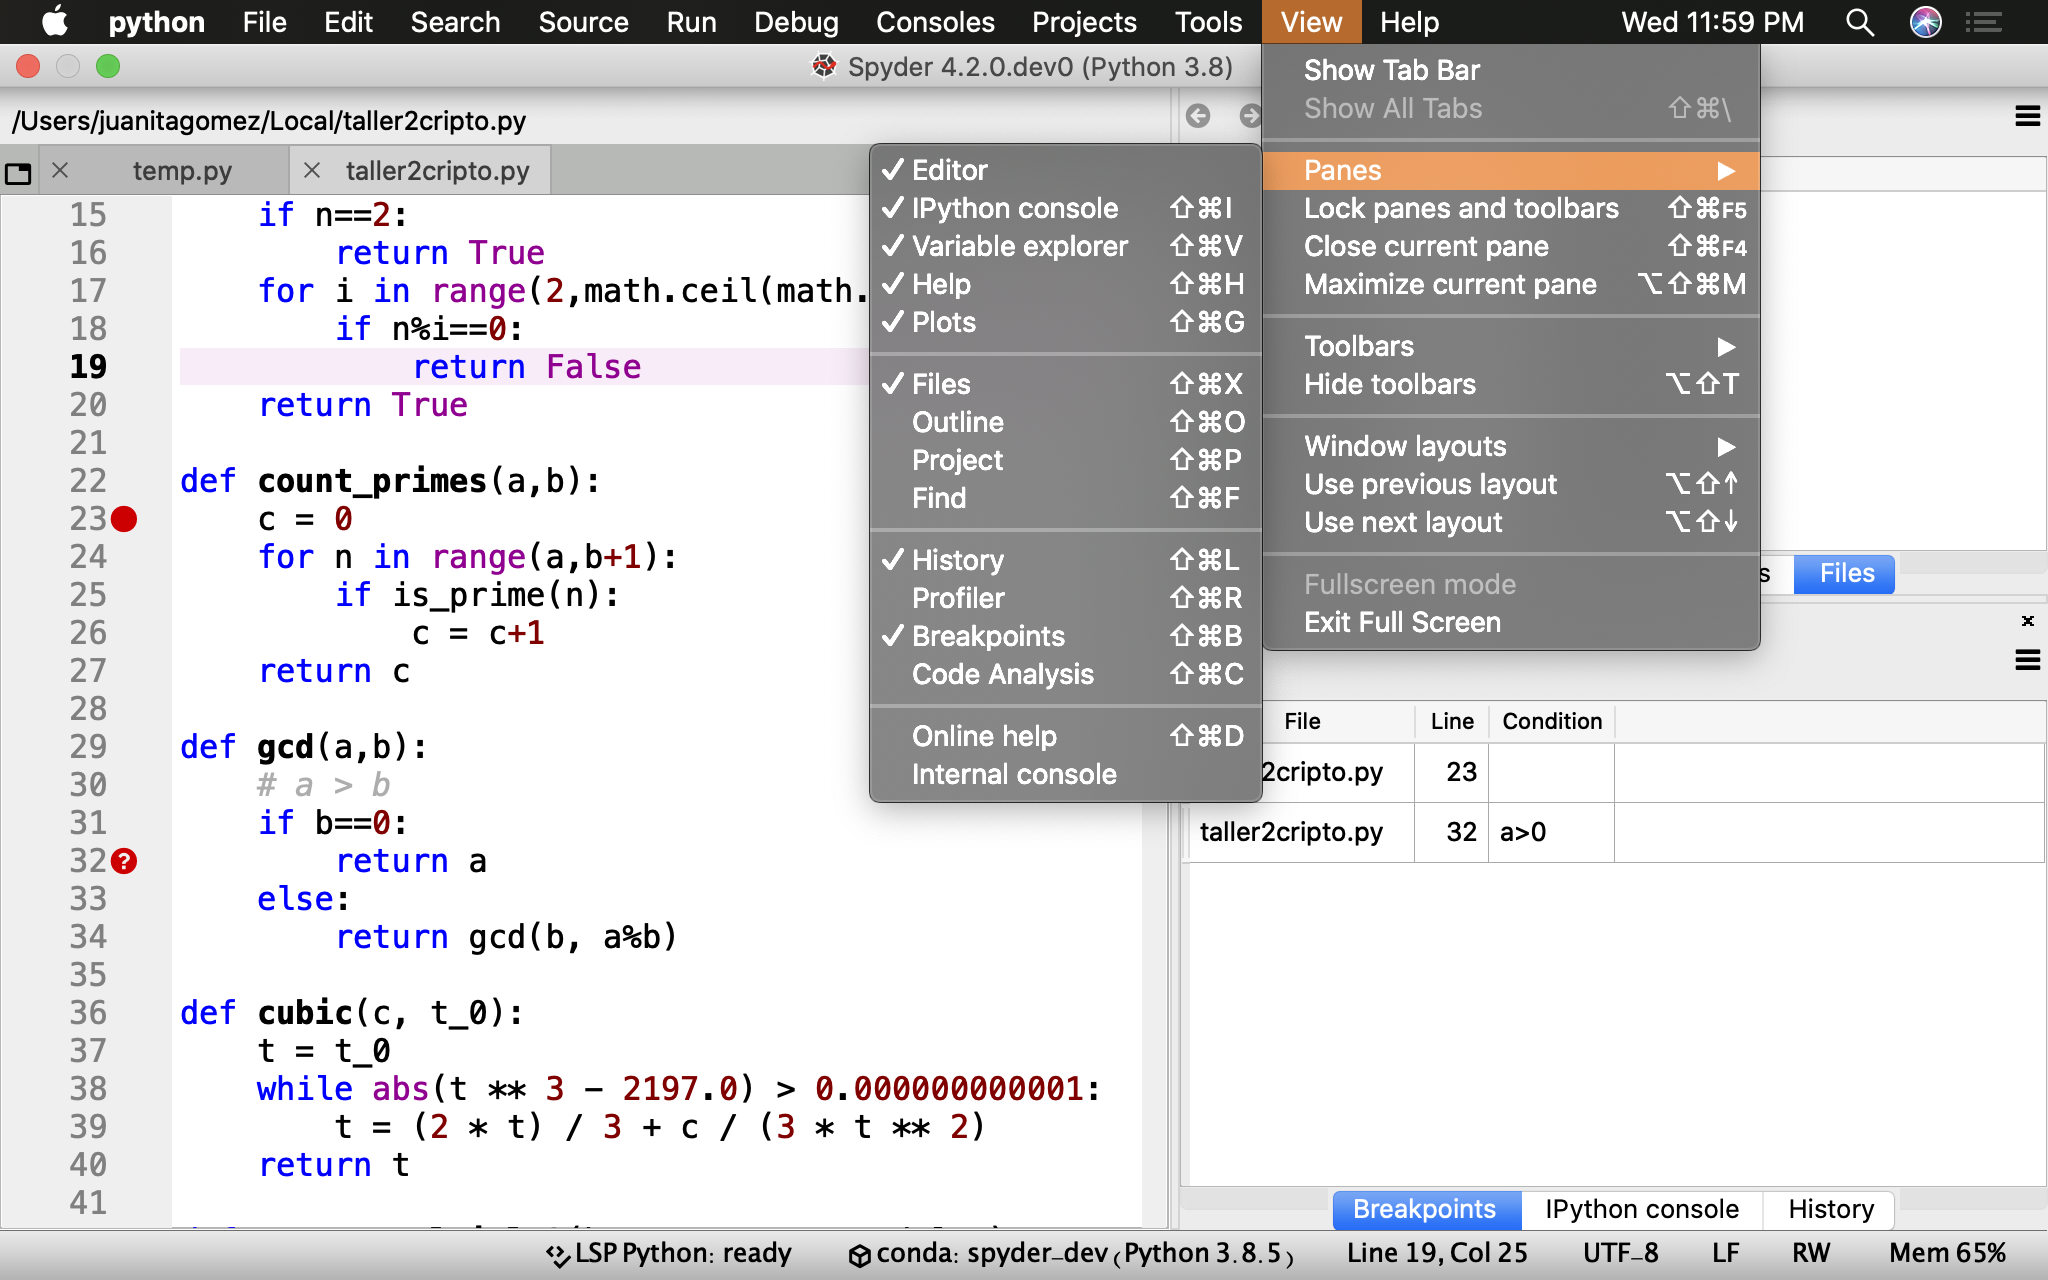
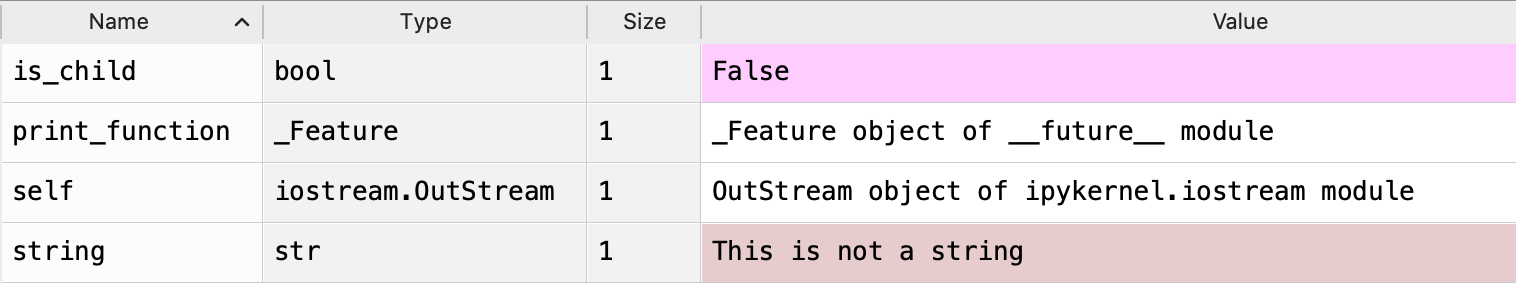
The Variable Explorer pane allows you to browse and modify the local namespace wherever the debugger is stopped.
The future
I'm excited for the new Frames Explorer pane, which is currently almost ready for Spyder 5. Usually while debugging, it can be hard to tell from where the current function was invoked, and one must often step up a long chain of calls to figure it out. With the Frames Explorer, you have direct access to all the relevant call information, and you can jump around the stack easily!
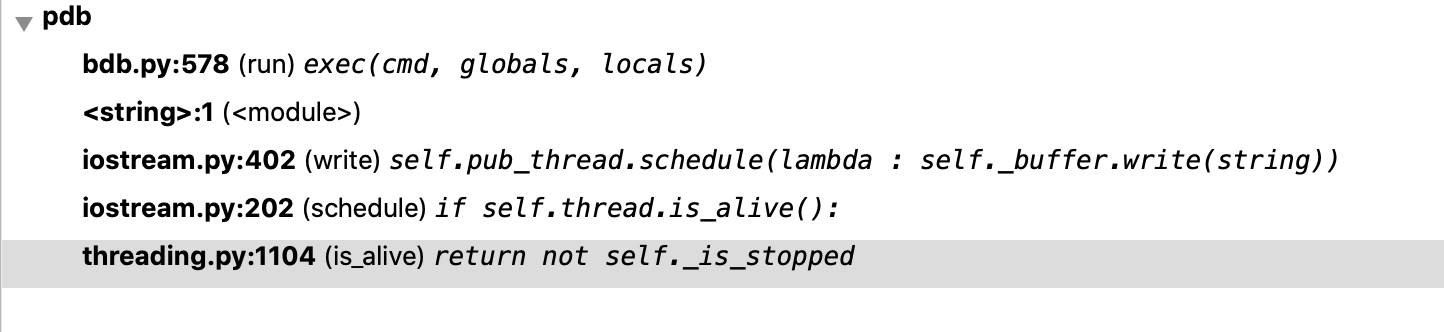
I can see where the current function was called from!
The next challenge I will be tackling is to enable the debugger to stop in threads. This is a bit difficult to implement because if two threads reach a breakpoint at the same time, only one of them can take control of the shell, leading to skipped breakpoints. This might be okay, but I'm still figuring that out.
Try out the new improvements in the Spyder debugger and let us know if they make your debugging easier!
Comments